

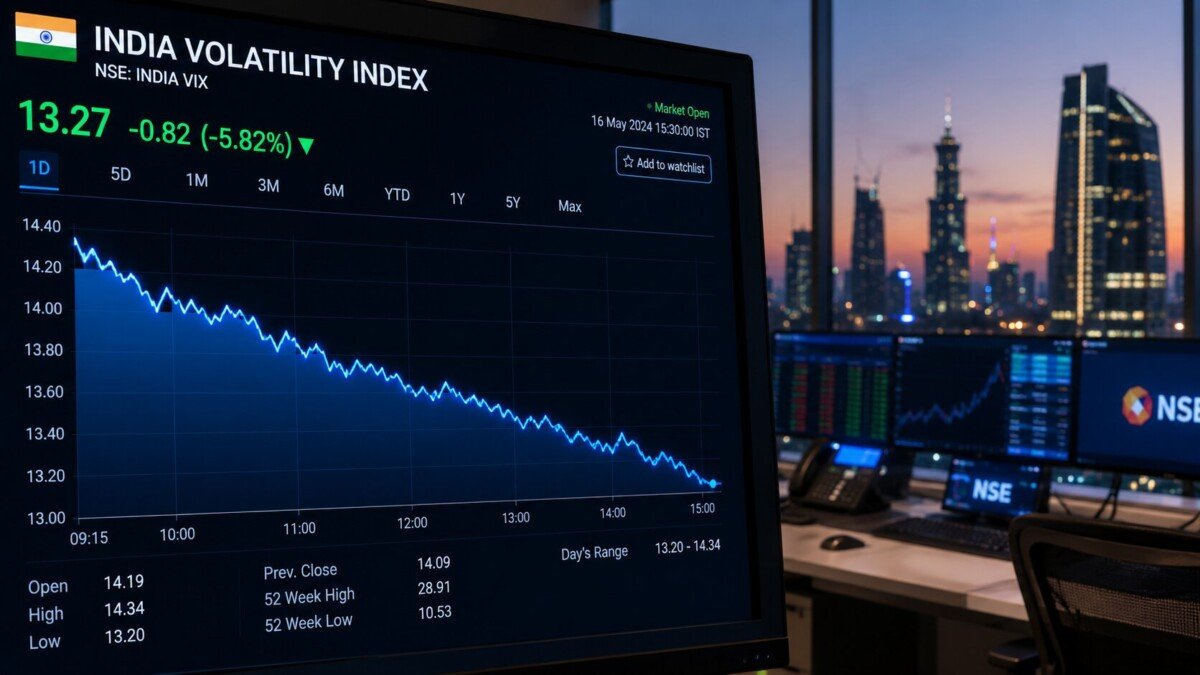
The nervousness that gripped Indian markets in mid-July continued to drain away as the month drew to a close. India VIX, the National Stock Exchange’s fear gauge, ended July’s final session lower once again — a quiet but telling sign that traders are bracing for calmer waters ahead, even with plenty of global risks still bubbling in the background.
Here’s what the numbers say, and why a mix of fading fear, thinner trading, and new central bank rules all played a part.
Where India VIX Closed
On the last trading day of July, India VIX settled at 11.75, shedding 0.41 points — a 3.37% drop from its previous close of 12.16. The move points to easing expectations of near-term market swings, and it held even as corporate earnings season rolled on and global uncertainties lingered.
The session itself was orderly. The index opened at 12.15, nudged up to an intraday high of 12.21, dipped as low as 11.64, and stayed comfortably inside its 52-week range of 8.72 to 28.90. Notably, despite the calm, India VIX has still delivered a hefty 25% year-to-date return as of July 31, 2026, while holding a “Neutral” technical trend rating.
The Mid-July Spike Keeps Fading
This latest slide is really the tail end of a bigger story. Earlier in the month — specifically that turbulent third week of July — volatility had shot up on the back of geopolitical jitters and a surge in hedging activity.
Since then, the fear gauge has steadily walked itself back down toward the 12–13 zone before finishing at 11.75. In plain terms, the implied volatility baked into Nifty options has cooled off considerably from those elevated mid-month readings. That said, it hasn’t collapsed to the rock-bottom levels you’d see during stretches of total market complacency, which suggests option pricing is still penciling in a modest, healthy dose of caution.
Stability Despite Lingering Global Risks
What’s striking is how contained things stayed given everything hanging over the market. Concerns around Middle East geopolitics, swings in crude oil prices, uncertainty over U.S. monetary policy, and the ongoing Q1 FY27 earnings season were all live issues — yet none of them triggered a fresh volatility shock on the month’s final day.
Instead, India VIX bounced around within a tight intraday band of 11.64 to 12.21. That narrow range tells you the market simply wasn’t expecting dramatic near-term moves. Lower implied volatility went hand in hand with cheaper option premiums, as broader market action stayed measured despite the external noise.
The Big Driver: Derivatives Turnover Dried Up
Here’s the factor doing a lot of the heavy lifting behind the scenes — trading activity in derivatives fell off a cliff during July.
Average daily futures and options turnover dropped 27.1% from the previous month. Dig deeper and the picture is even starker: index futures turnover tumbled 37.2%, while index options premium turnover fell 23.5% month-on-month. All told, market activity sank to its weakest levels since November 2023.
Why does this matter for the fear gauge? Because India VIX is calculated directly from Nifty option prices. When fewer people are trading options, and premiums soften as a result, implied volatility naturally stays subdued — regardless of what’s happening on the macro or geopolitical front.
RBI’s New Funding Rules Change the Game
So what caused trading to thin out so dramatically? A major piece of the puzzle is regulatory. The Reserve Bank of India’s revised funding framework kicked in on July 1, 2026, and it has reshaped how firms trade.
Under the new rules, banks are no longer permitted to finance proprietary trading activities, and broker funding now requires 100% collateral. The practical effect is a sharp reduction in the leverage available to trading firms — which, in turn, has meant less speculative participation, quieter intraday activity, and shrinking options volumes across the board.
Analysts add an important caveat: the full impact may not have shown up yet. As existing bank guarantees expire over the coming months, the effect of these measures could become even more visible.
Why Volatility Hasn’t Hit Rock Bottom
With fear fading and trading thinning, you might expect India VIX to sink into single digits. It hasn’t — and earnings season is the reason.
The ongoing Q1 FY27 results have kept generating company-specific price swings across sectors. As investors sift through individual results, you get sector rotation and pockets of selective hedging, even while broad-market volatility stays low. That stock-level uncertainty has effectively put a floor under the index, keeping it hovering near the 12 mark rather than drifting toward the ultra-calm single-digit readings.
Rate Outlook and Global Events Still in Focus
Beyond earnings, market participants kept one eye firmly on the RBI’s policy stance and global developments. The broad expectation among economists is that the central bank will hold the repo rate steady through the rest of 2026, leaning toward supporting growth while keeping watch on inflation risks tied to geopolitics and oil.
Those stable policy expectations have dovetailed neatly with the moderating volatility. Still, developments in global energy markets, geopolitical flashpoints, and decisions from overseas central banks remain firmly on the radar, given their potential to move option pricing and stir up short-term volatility.
A Look at the Bigger Picture
The July close underscores just how far volatility has retreated from the highs seen earlier this year. India VIX sits well below its 52-week peak of 28.90 — a level touched during periods of intense geopolitical stress — while staying comfortably above the 52-week low of 8.72.
History also offers useful context here. July has been a seasonally weak month for the fear gauge, with 15 of the last 18 years posting negative VIX returns during the month and an average monthly decline of 8.86%. The biggest July jump on record was 7.39% in 2011, and the sharpest drop was 24.22% in 2022. On the charts, the index keeps its Neutral trend rating, with Classic pivot levels marked at a pivot point of 11.92, resistance at 12.55/12.93/13.56, and support at 11.54/10.91/10.53.
The Bottom Line
India VIX wrapped up July at 11.75, extending the cooldown that followed the month’s mid-July volatility spike. The closing level reflects a blend of forces rather than any single event: quieter derivatives activity, the RBI’s leverage-curbing funding rules, steady rate expectations, and a floor provided by earnings-driven stock moves. For now, the market looks measured — but with global geopolitics and crude prices still in play, traders aren’t letting their guard down entirely.
[…] front, Newell raised its full-year operating cash flow outlook to approximately $400 million. That figure comes with a big assumption baked in: it presumes the company receives substantially all of its […]